Today’s AI Top Pick: HDB
9/4/2026 · Lean Rider screen · a free sample of K3vl4r’s AI-curated picks.
AI-ranked from a screened shortlist, with entry strategy, targets, and risks.
View the live HDB price forecast →
HDB is the cleanest multi-timeframe alignment in the entire pool combined with the deepest oversold position and the best fundamentals. Every single forecast bucket across every timeframe is positive: 1h fc mid/long +1.18/+3.29, 4h +1.12/+1.52/+13.64, 1d +5.60/+21.95/+14.93, and — critically — even the 1wk forecast is positive at +4.14/+21.19/+22.17. No other candidate has weekly forecasts pointing up; VST, TMUS, RDDT, BWXT, CLS, VRT, TSM all show weekly forecast collapses of -20% to -80%. HDB is the only name where the tape agrees across all four horizons. Position in range is the second reason. HDB sits at just 5.01% of its 21-bar weekly range and -15.30% drawdown from the weekly high, with 1d position at 71.97% (mid-upper daily but deeply oversold weekly). This is precisely the 'don't chase' setup the lens asks for — you're buying near a multi-week low, not at the top like VST (100% of 4h range), CLS (100% 1h), or VRT (100% 1h/4h). Combined with bullish_prob 1.0 and near_term_bullish 0.8, the probability structure is stacked. Fundamentals cement it: PE 13.73, fwdPe 12.04, PEG 0.84, ROE 13.7%, profit margin 15.96%, debt/equity 0.93, analyst recom 1.26 (strongest in pool alongside SBS), targetUpsidePct 35.4%. This is a Tier-1 Indian bank at a value multiple with strong buy-side conviction — none of the flashier names (TSM, VRT, CLS) have this combination of cheap AND oversold AND multi-TF confirming. The landmine to acknowledge: the Sept 1 headline 'HDFC Bank Hits 30-Month Low as CEO Exit Deepens Overhang.' That's real, but the -36% YTD / -34% YoY drawdown and the 5% weekly range position tell you it's largely priced in, and the forecast tape is projecting reversion (weekly fc long +22.17%). Waiting risks missing the mean-reversion trigger since 1d and 4h forecasts point to double-digit moves within weeks. Today's entry is the right one because you're catching capitulation-adjacent price with every timeframe forecast agreeing on upside — a rare combination in this pool.
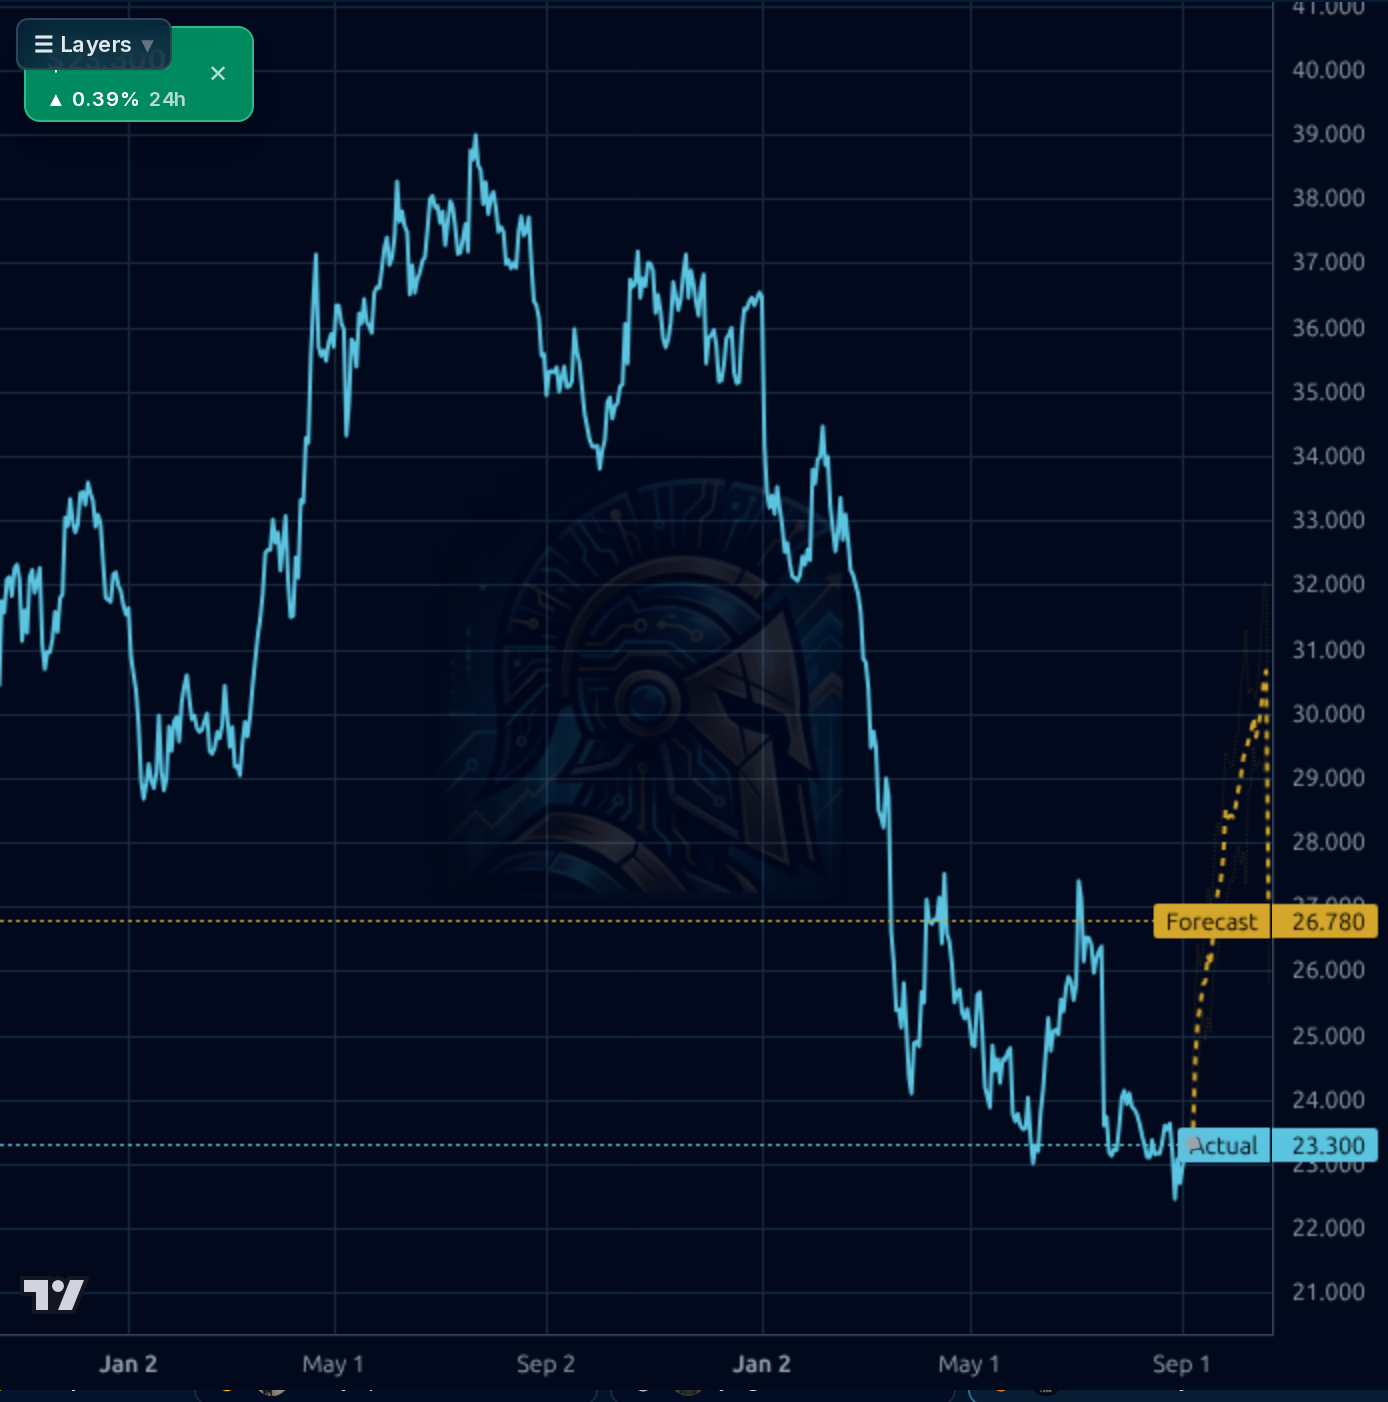
- CEO exit overhang could deepen if a weak replacement is named — the Sept 1 30-month low headline shows the market is nervous
- ADR-specific risk: INR/USD FX moves can amplify losses; -36.29% YTD reflects both operational and currency headwinds
- SalesYoY -4.47% shows top-line already contracting; if Q2 print misses, the low-PE thesis weakens
- Weekly drawdown of -15.30% could extend to -20%+ if EM/India sentiment sours; stop at $21.90 caps this
- Institutional ownership only 13.12% (ADR structure) means less flow support vs. domestic name during panic
| # | Symbol | Verdict | Score | Read |
|---|---|---|---|---|
| 1 | HDB | BUY NOW | 8.6 | Only name with all four TFs pointing up; 5% weekly range, PE 13.7, recom 1.26 — best confluence in pool despite CEO overhang. |
| 2 | AZO | BUY NOW | 7.4 | Deeply oversold weekly (4.98% range), near-term bullish 1.0, 1d fc +15.52% mid — clean setup with only mild weekly softness. |
| 3 | CCI | BUY PULLBACK | 7.0 | All-TF positive forecasts and 1wk fc long +15.74%, but 1d at 89.86% range top argues for a small pullback entry. |
| 4 | RDDT | BUY PULLBACK | 6.4 | Licensing relief catalyst + 1d fc +12.10% mid, near-term bullish 1.0, but 1wk fc long -60.31% is a material overhead. |
| 5 | BBWI | BUY PULLBACK | 6.0 | FwdPe 6.83 and 1wk fc +67% long look explosive, but 1h at 90.8% of range and small-cap ($3.8B) argue for waiting for a pullback. |
| 6 | BWXT | BUY PULLBACK | 5.6 | Positive NNSA/Jefferies catalysts and 1d fc +8.96% mid, but 4h at 100% of range and 1wk fc long -25.63% conflict. |
| 7 | TMUS | WAIT | 5.0 | Solid fundamentals (fwdPe 13.53, recom 1.5) but 1wk fc long -9.88% and CFO transition create near-term drift risk. |
| 8 | VST | WAIT | 4.4 | 4h at 100% of range with 1wk fc long -38.58% — Thiel disclosure is bullish narrative but tape is stretched. |
| 9 | SBS | WAIT | 4.2 | Recom 1.0 and PE 11.85 are attractive, but 1wk fc long -32.92% and thin US news flow are red flags. |
| 10 | GME | AVOID | 3.6 | TargetUpsidePct -29.8% and recom 3.0 with 1h fc long -3.28% — screen pass on lean only, no confirmation. |
| 11 | IONQ | AVOID | 3.2 | 1wk fc long -49.13% and profitMargin -560% — screen entry that the forecast tape actively rejects. |
| 12 | CLS | AVOID | 2.8 | 1h at 100% range with 1wk fc long -62.89% and bullish_prob 0.2 — parabolic top signature. |
| 13 | CVLT | AVOID | 2.6 | Bullish_prob 0, PE 87.45, and 1wk fc long -23.11% — valuation and tape both hostile. |
| 14 | VRT | AVOID | 2.2 | 1h/4h at 100% range with 1wk fc long -80.14% and bullish_prob 0 — textbook late-cycle top. |
| 15 | TSM | AVOID | 2.0 | 1h at 100% range with 1wk fc long -64.46% and bullish_prob 0 — screen pass overridden by broken forecast tape. |
Get AI top picks & forecasts on any stock
K3vl4r screens the market daily and ranks the best setups with AI — forecasts, scored fundamentals & technicals, and multi-horizon price targets. Create a free account to explore them all.
Create your free account →Already a member? Sign in · Join our Discord