Today’s AI Top Pick: SAP
7/21/2026 · AI Conviction screen · a free sample of K3vl4r’s AI-curated picks.
AI-ranked from a screened shortlist, with entry strategy, targets, and risks.
View the live SAP price forecast →
SAP is the cleanest asymmetric setup in this pool: a beaten-down high-quality tech name (perfYtd -34.81%, perfYear -48.25%, 21-bar weekly drawdown -21.67%) where the model forecast tape has flipped decisively bullish across the mid/long horizon at the same time an analyst upgrade note ('SAP: Upgrading To Buy After 40% Crash') just hit. On daily, the model projects fc_short +23.33%, fc_mid +42.09%, fc_long +43.48% — the largest positive forecast magnitudes anywhere in this pool — with bullish_prob=1.0 and near_term_bullish=0.8. Crucially, price sits at pos_in_21bar_range 1.44% on the weekly and 17.8% on the hourly, meaning you are NOT chasing; you're buying near the bottom of a compressed range, exactly where the winners in this scan tend to entry-cluster. Multi-timeframe alignment is strong: 4h fc_short/mid/long = +19.73 / +26.07 / +39.37, 1d = +23.33 / +42.09 / +43.48, and even the battered 1wk forecast has turned constructive (+6.17 mid, +15.12 long). The only mildly negative slice is the 1h fc_short which is still +6.03%. Fundamentals reinforce the story: fwdPE 16.21, PEG 1.00, gross margin 75.9%, operating margin 28.6%, profit margin 20.0%, debt/equity 0.18, recom 1.53, targetUpsidePct 55.9%, and fundamental_score 5.75. That is a rare combination of value + quality + consensus support after a 40%+ crash. Why TODAY vs waiting: SAP is basement-of-range while the model expects mean-reversion of 20–40% over the mid horizon; every day spent 'waiting' risks the snap-back move the forecast is pricing. Compare to alternatives — TSM has the best fundamentals in the pool but the model tape is red across every horizon (1d fc_mid -31.5%, 1wk fc_long -63.9%); MSFT and MELI have bullish_prob=1 but are already pinned at pos_in_21bar_range 93.85% and 97.61% respectively (chasing); FOX has near_term_bullish=1 but sits at daily pos 98.9% with a -30% weekly forecast. SAP is the only name combining deep discount + strong forecast + high probability + supportive fundamentals + friendly recent news. Risk-management-wise, the setup gives you a clear invalidation: if SAP breaks the recent low around $148 the 40% capitulation trade is still bleeding and you step aside.
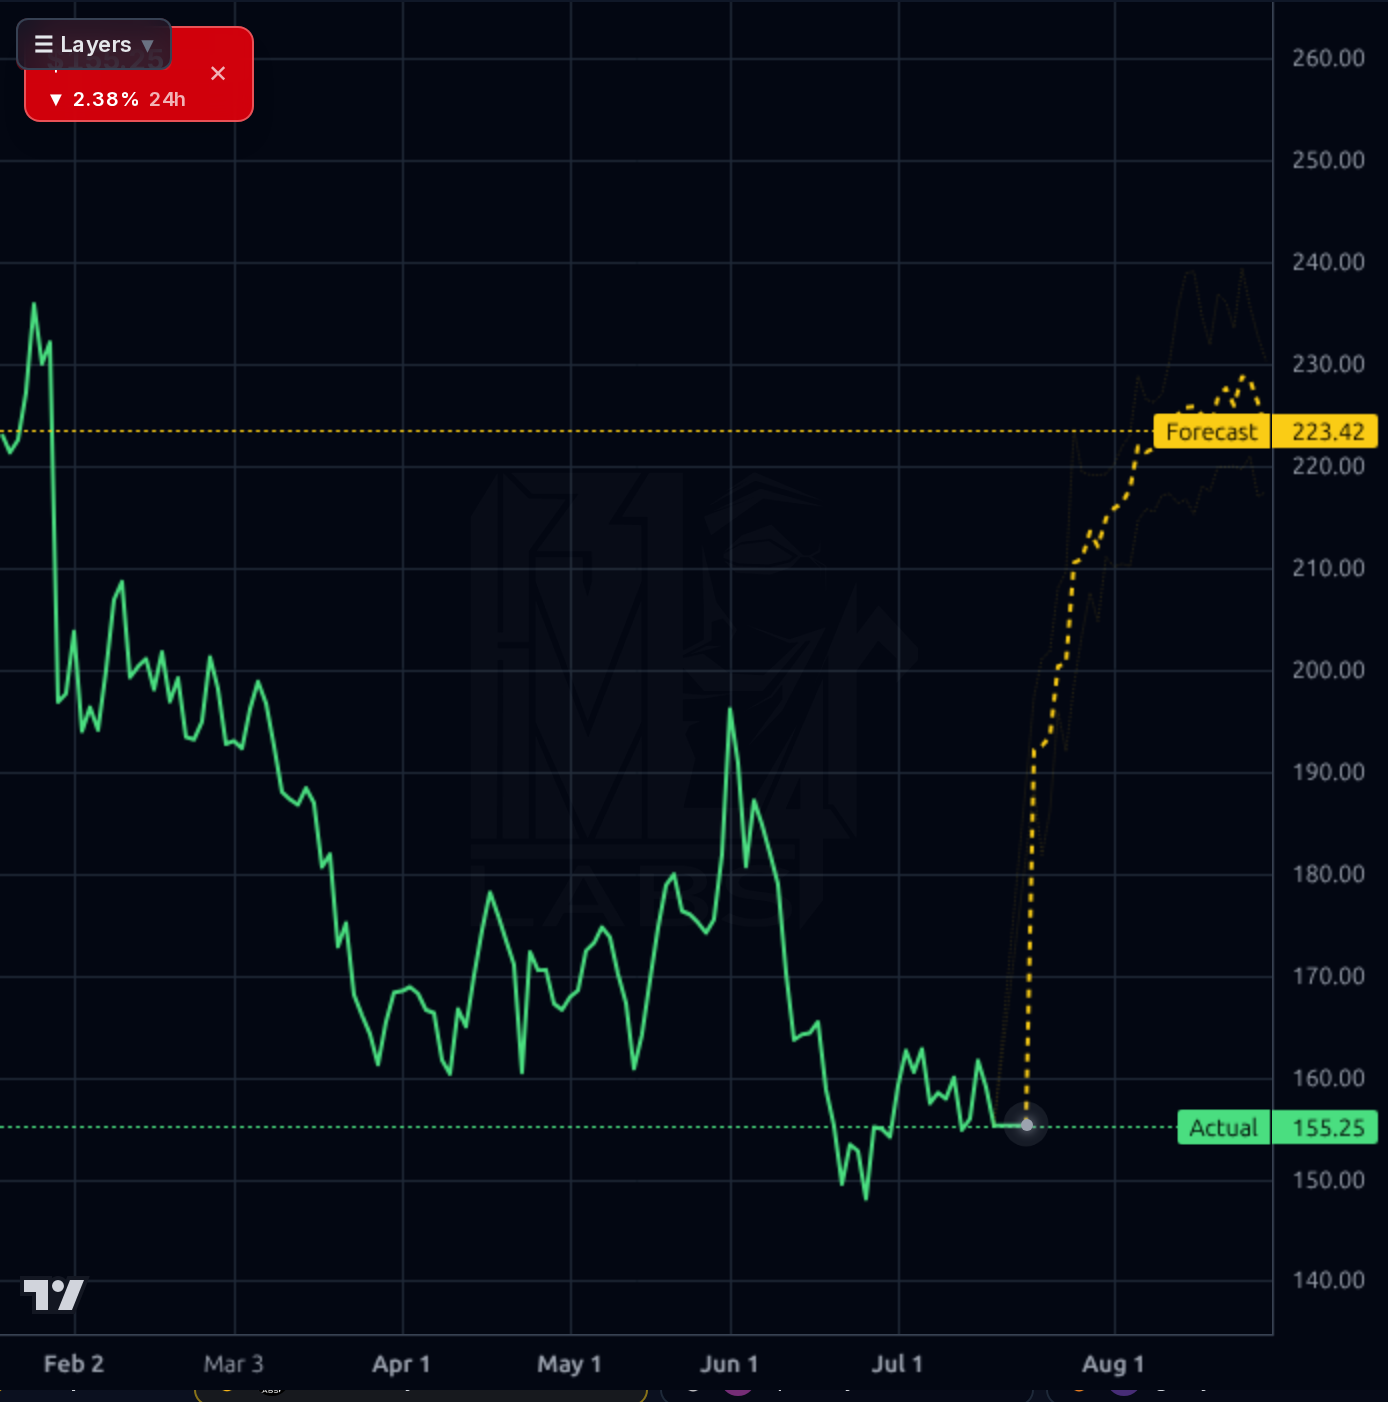
- Weekly trend still broken — dd_from_21bar_high -21.67% and perfYear -48.25% mean you're catching a falling knife; if $148 fails, the next support could be well lower
- Model shows 1h fc_mid/long only +8.3%/+7.09% — near-term upside is modest, so the trade needs the mid-horizon (weeks) to play out, not intraday
- ADR / FX risk: SAP moves on EUR/USD and any euro weakness cuts into USD-denominated returns
- Enterprise IT spending slowdown — salesYoY 14.77% is decelerating vs prior periods; another guide-down at next print re-anchors the drawdown
- Sector rotation risk: if the 'HSBC sees warning signs in risk assets' narrative broadens, high-beta software gets sold regardless of company-specific catalysts
| # | Symbol | Verdict | Score | Read |
|---|---|---|---|---|
| 1 | SAP | BUY NOW | 8.8 | Deep-drawdown quality name with the largest positive forecast tape in the pool (1d fc_long +43.5%) and price at 1.44% of weekly range. |
| 2 | AZN | BUY NOW | 7.4 | Oversold healthcare compounder at pos_in_21bar_range ~4% with bullish_prob 1.0 and 4h fc_mid +15.5%. |
| 3 | MSFT | BUY PULLBACK | 6.8 | Elite fundamentals and 1d fc_long +16.2%, but pinned at 93.85% of daily range — wait for a pullback to $385. |
| 4 | FOX | BUY PULLBACK | 6.5 | All near-term forecasts positive (1d fc_mid +10.7%) and Citi 'buy the dip' call, but at 98.9% of daily range with 1wk fc_long -30.8%. |
| 5 | MELI | BUY PULLBACK | 6.2 | bullish_prob 1.0 and 1d fc_long +11.7%, but pos_in_21bar_range 97.6% on weekly — chasing, not buying. |
| 6 | MMSI | BUY PULLBACK | 5.8 | Bullish_prob 1.0 and 1d fc_mid +10.2%, but 1h/4h short-term forecasts are red and price sits at 88% of weekly range. |
| 7 | FCX | WAIT | 5.3 | Cheap on PEG 0.41 with earnings catalyst incoming, but 1wk fc_long -35% and 1d fc_mid -14.9% are red flags. |
| 8 | DXCM | WAIT | 5.0 | Truist raised PT to $87 but model shows 1d fc_mid -10.9% and 4h fc_mid -11.1%; wait for the tape to catch up to the analyst. |
| 9 | MDLN | WAIT | 4.8 | Only 1h data available (+12% mid/long forecast) — insufficient multi-timeframe evidence to size up. |
| 10 | TSM | WAIT | 4.5 | Best fundamental_score 8 in the pool but forecast tape is a bloodbath: 1d fc_mid -31.5%, 1wk fc_long -64%. Wait for the model to turn. |
| 11 | FIVE | WAIT | 4.4 | 1d pos_in_21bar_range 100% and 1wk fc_long -15.6% — extended and forecasts fading. |
| 12 | GEN | WAIT | 4.2 | Cheapest tech name (fwdPE 8.09) but all forecast horizons negative on 1h/4h and 1wk pos 94.5%. |
| 13 | FWONK | WAIT | 4.0 | B of A raised PT to $115 but model has 1d fc_mid -8.4% and 1wk fc_long -25.7% at pos 100%. |
| 14 | HUBB | WAIT | 3.9 | Some short-term positive forecasts on 1h but 1wk fc_long -28.7% and daily drawdown -8.9%. |
| 15 | LECO | WAIT | 3.8 | 1h/4h forecasts turning positive (+8% mid) but Morgan Stanley Underweight and 1wk fc_long -25%. |
| 16 | APH | WAIT | 3.6 | 1wk fc_long -66% is a hard pass despite pos 74.3%; forecast tape says wait for stabilization. |
| 17 | GRMN | WAIT | 3.5 | Every forecast horizon negative, no catalyst; sit out despite decent fundamentals. |
| 18 | RTX | WAIT | 3.4 | Positive Pratt & Whitney/Red Kite headlines but 1wk fc_long -50.4% and fundamental_score just 2. |
| 19 | NVS | WAIT | 3.3 | Earnings-buoyed narrative but 1d fc_mid -13% and 1wk fc_long -40%; targetUpsidePct only 2.6%. |
| 20 | HSBC | WAIT | 3.1 | At pos 100% of weekly range with 1wk fc_long -62%; HSBC's own analysts flagging 'warning signs.' |
| 21 | HAFN | WAIT | 3.0 | Cheapest PE 8.11 but epsNextY -36% and 1d fc_mid -21%; tanker cyclicality warning. |
| 22 | ECG | AVOID | 2.9 | 1d dd -18.6% at pos 5.6% AND 1d fc_long -30% — no bottom signal yet. |
| 23 | RGA | AVOID | 2.8 | RSI 72.5, pos 100% weekly, and every forecast horizon deeply negative (1wk fc_long -27.8%). |
| 24 | NTAP | AVOID | 2.7 | 1d fc_short -33.5%, 1wk fc_long -39.9%, ROE 106.7 skew from buybacks; wait for the forecast to reset. |
| 25 | GD | AVOID | 2.5 | Fundamental_score 1.5, pos 95% weekly, 1wk fc_long -30%; extended defense name. |
| 26 | MYE | AVOID | 2.4 | Every horizon forecasts -20% to -48%; the +43% weekly rally has fully priced in the good news. |
| 27 | DOCN | AVOID | 2.0 | Just diluted with $500M convertible-swap-for-stock and 1wk fc_long -73.8%; classic pump-and-dilute setup. |
| 28 | EZPW | AVOID | 1.9 | 1d fc_short -39%, 1wk fc_long -64.5%, short float 21.4%; forecast tape is disaster. |
| 29 | MTRN | AVOID | 1.7 | PE 66, +156% perfYear, and 4h fc_long -35.8%; every risk factor lit up. |
| 30 | BBC | WAIT | 1.5 | ETF with no fundamentals and no multi-timeframe data provided; can't underwrite. |
Get AI top picks & forecasts on any stock
K3vl4r screens the market daily and ranks the best setups with AI — forecasts, scored fundamentals & technicals, and multi-horizon price targets. Create a free account to explore them all.
Create your free account →Already a member? Sign in · Join our Discord