
Today’s AI Top Pick: TMUS
8/12/2026 · Lean Rider screen · a free sample of K3vl4r’s AI-curated picks.
AI-ranked from a screened shortlist, with entry strategy, targets, and risks.
View the live TMUS price forecast →
TMUS is the cleanest fundamentals-meet-tape setup in this pool. It carries the highest fundamental_score (8), a bullish_prob of 1.0 and near_term_bullish of 0.6, alongside the kind of valuation the rest of the top-fund_score names simply don't have: PE 18.69, fwdPe 12.85, PEG 0.65, ROE 17.99, operMargin 21.17, salesYoY 9.68, analyst recom 1.43, and 35.1% targetUpside. Unlike Meta (extended, 4h pos_in_range 94%, weekly fc -8.7% to -12.3%) or the euphoric AI names (ALAB, VRT, CRDO, AMD all have daily fc's of -30% to -70%), TMUS's forecast tape actually confirms the fundamentals. Multi-timeframe agreement is the tell: 4h fc (+1.93 / +3.98 / +7.73), 1d fc (+3.08 / +13.46 / +12.66), while the 1h is neutral (-0.59 / +0.03 / +0.04) — no extreme single-bar outlier distorting the picture. The weekly forecast is mildly negative (-6.2 / -2.33 / -3.3) but that reflects a 1wk recent_21bar_pct of -15.05% and a -15% drawdown — you're buying INTO that weekly digestion, not on top of it. Position_in_21bar_range is 27% (1h), 30% (1d), 14% (1wk) — the opposite of chasing. Contrast that with UBER (100% weekly range, -10.75% long fc) or KGC (100% daily range, -68% weekly long fc). Today is the entry, not later: the 1h/4h are already inflecting positive off the -15% weekly pullback, RSI 48 leaves room, and the recent [2026-08-12] Simply Wall St. "27% Undervalued On New Plan Rollout" headline is a clean positive catalyst. The lone caution — a [2026-08-11] Benzinga "5 Earnings Losers With More Downside" mention — is generic list-fodder, not a guidance cut or legal action. Waiting risks losing the reload from the middle of the daily range while the daily fc's +13% mid-horizon plays out. I passed on ZTS despite a jaw-dropping 1wk fc (+103%) and deeply oversold position (5.23% of range) because those magnitudes look like extreme forecast outliers on a -37.86% drawdown, and near_term_bullish is only 0.6. I passed on META because 4h is at 94% of range and the weekly forecast is decisively negative (-8.71 / -12.33), plus fresh 29-state youth-social-media lawsuit headline. TMUS gives you the same fund_score with a cleaner tape and a supportive catalyst.
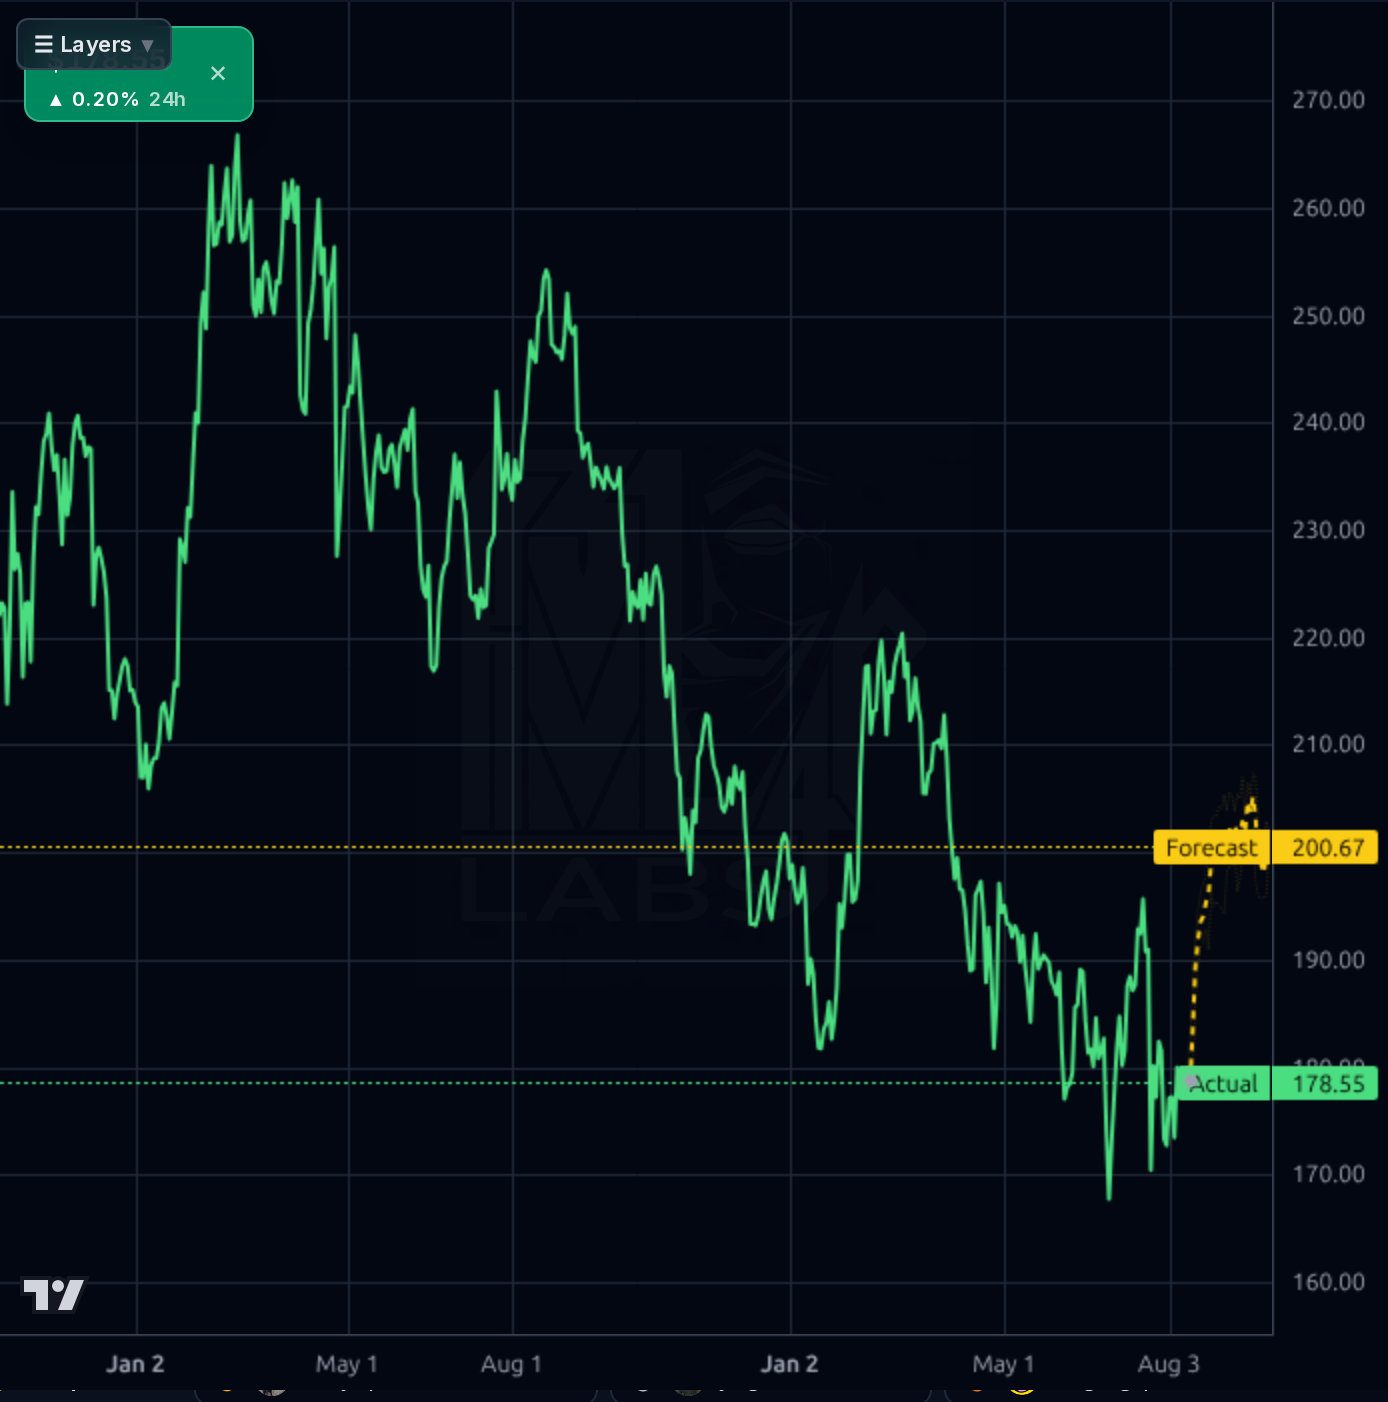
- Weekly tape still hostile: recent_21bar_pct -15.05% and weekly fc negative (-6.2 / -2.33 / -3.3) — a broader market pullback could re-test $170
- debtEq 2.12 is elevated for a defensive-looking name; rising-rate scare would compress the fwdPe 12.85 story
- Perf trailing badly (perfYtd -12.05%, perfYear -28.24%) means overhead supply on rallies into $190
- instOwn only 42.46% (unusually low for a $191B mega-cap) — leaves it more sentiment-driven than META/MCD
- The 'Earnings Losers With More Downside Ahead' Benzinga piece [2026-08-11] hints at lingering post-print negativity into the tape
| # | Symbol | Verdict | Score | Read |
|---|---|---|---|---|
| 1 | TMUS | BUY NOW | 8.6 | Fund_score 8 + cheap fwdPe 12.85 + daily fc +13.5% mid, entering off a -15% weekly pullback not the top of range. |
| 2 | LKQ | BUY NOW | 7.8 | Perfect near_term_bullish 1.0 with all four TFs green and 1wk fc_long +70.97% from position 25.6% of range. |
| 3 | SBAC | BUY NOW | 7.4 | Quiet all-TF-up REIT: bullish_prob 1, near_term 0.8, daily and weekly forecasts consistently +7% to +15%. |
| 4 | ZTS | BUY PULLBACK | 7.1 | Deeply oversold reversal (1wk pos 5.23%, dd -37.86%) with huge fc's, but near_term_bullish 0.6 and forecasts look outlier-sized. |
| 5 | META | BUY PULLBACK | 6.9 | Fund_score 8, near_term 1.0, but 4h at 94% of range and 1wk fc negative (-8.7/-12.3) plus fresh 29-state lawsuit. |
| 6 | MCD | BUY PULLBACK | 6.6 | Defensive with all-TF bullish signals and near_term 1.0, but 1d position at 83% — better entry after a dip. |
| 7 | CRH | BUY PULLBACK | 6.4 | Near_term 1.0 and 1d fc +8.24% long, but 4h at 100% of range and 1wk long fc -22.8% is a caution. |
| 8 | STZ | BUY PULLBACK | 6.2 | Cheap (PE 12.78), weekly fc +51.58% long from oversold pos 14%, but fund_score 3.5 and Cramer questioning it. |
| 9 | DKS | BUY PULLBACK | 5.7 | Wells Fargo upgrade + fund_score 5.75 + bullish_prob 1, but near_term 0.2 and 1h just broke down. |
| 10 | CELH | WAIT | 5.5 | Huge daily fc (+53% mid) but PE 121, weekly dd -20.6%, and fresh exec shake-up headline. |
| 11 | AGI | WAIT | 5.1 | Gold miner at 100% of daily range with 1wk fc_long -55.74% — extended, not a fresh entry. |
| 12 | BEKE | WAIT | 4.6 | bullish_prob 0, mixed forecasts, partial TF coverage, no near-term catalyst. |
| 13 | KGC | WAIT | 4.4 | RSI 65.15, at 100% of daily range, 1wk fc_long -68.68% — chase risk on a hot gold name. |
| 14 | DKNG | WAIT | 4.4 | Fund_score 1.25, no earnings, at 99% of daily range — parabolic setup even with a Citi upgrade. |
| 15 | SQM | WAIT | 4.1 | Daily fc -11.23/-11.96 and weekly fc -22.64 long undercut the fund_score 6.5. |
| 16 | UBER | WAIT | 4.0 | 100% weekly range, cyber-incident headline, and every TF fc turns negative in mid/long. |
| 17 | CSGP | WAIT | 3.9 | PE 171 with expected_return null and modest tape; CEO insider buy is a plus but not enough. |
| 18 | BG | WAIT | 3.7 | 1h collapse (-13.53% recent) and all TFs negative in mid/long horizons despite fund_score 8. |
| 19 | HAL | WAIT | 3.6 | Daily and weekly fc negative (-11% mid, -18% weekly dd) — screen passes but tape fails. |
| 20 | MLM | WAIT | 3.5 | Fund_score 3.25 with fwdPe 25.48 and no near-term forecast edge. |
| 21 | MTSI | AVOID | 3.0 | 1d fc_mid -39.32% and 1wk fc_long -61.93% after +153% year — extended top. |
| 22 | COHR | AVOID | 2.9 | PE 157, 1wk recent +189% and forecasts sharply negative across horizons. |
| 23 | ADEA | AVOID | 2.8 | PEG 5.5, bullish_prob 0, daily fc -36% mid, weekly fc_long -59.76%. |
| 24 | AMD | AVOID | 2.6 | Daily fc_short -71.56% is a hard signal against chasing after +137% weekly move. |
| 25 | ALAB | AVOID | 2.6 | P/S 45, 4h fc_long -34.1%, 1wk fc_long -54.29% — screen artifact, not a real setup. |
| 26 | CRDO | AVOID | 2.5 | 1d fc_short -52.39% and 1wk fc_long -77.37% after +168% weekly parabola. |
| 27 | FLEX | AVOID | 2.4 | 1d fc_short -59.66% and 1wk fc_long -70.36% — cash-flow-cheap but tape is broken. |
| 28 | FIX | AVOID | 2.2 | bullish_prob 0, 1wk fc_long -73.69% after +143% perfYear — classic blow-off top risk. |
| 29 | VRT | AVOID | 2.2 | At 100% of 1h and 4h range with 1wk fc_short -47.38% / fc_long -82.32%. |
| 30 | BE | AVOID | 1.9 | PE 287, perfYear +461%, 1wk fc_long -83.87% — the definition of don't chase. |
Get AI top picks & forecasts on any stock
K3vl4r screens the market daily and ranks the best setups with AI — forecasts, scored fundamentals & technicals, and multi-horizon price targets. Create a free account to explore them all.
Create your free account →Already a member? Sign in · Join our Discord